NetSuite Estimated Unit Cost on Inventory Adjustments
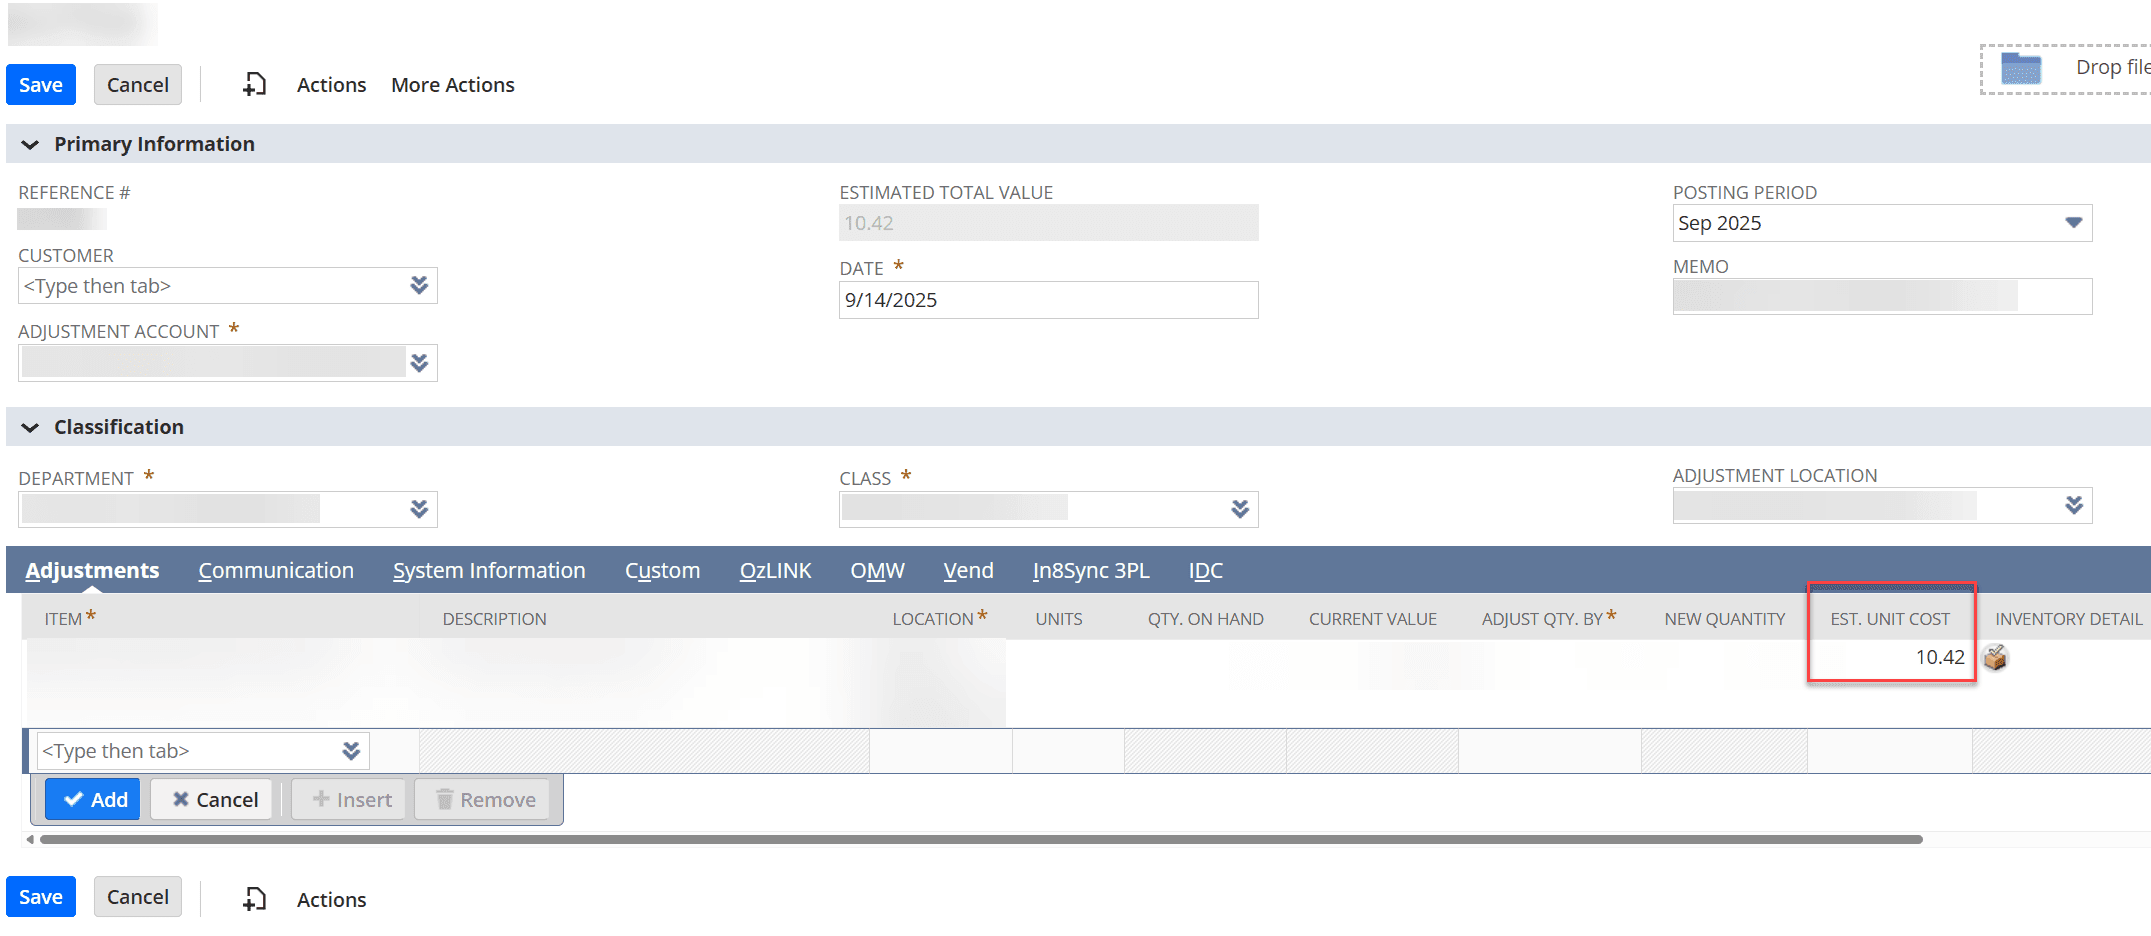
A client had noticed that the field Est. Unit Cost on inventory adjustment lines was being populated with different values on different adjustments.
Date
November 20, 2026
Read
2 min
Why the Values Differ
A client had noticed that the field Est. Unit Cost on inventory adjustment lines was being populated with different values on different adjustments.
Image shows an inventory adjustment record with the Est. Unit Cost highlighted.
For example:
Adj 1 has Est Unit Cost of $10
Adj 2 has Est Unit Cost of $10.42.
The client was wondering why this was and how the system populates the value in this field.
What Is the Est Unit Cost?
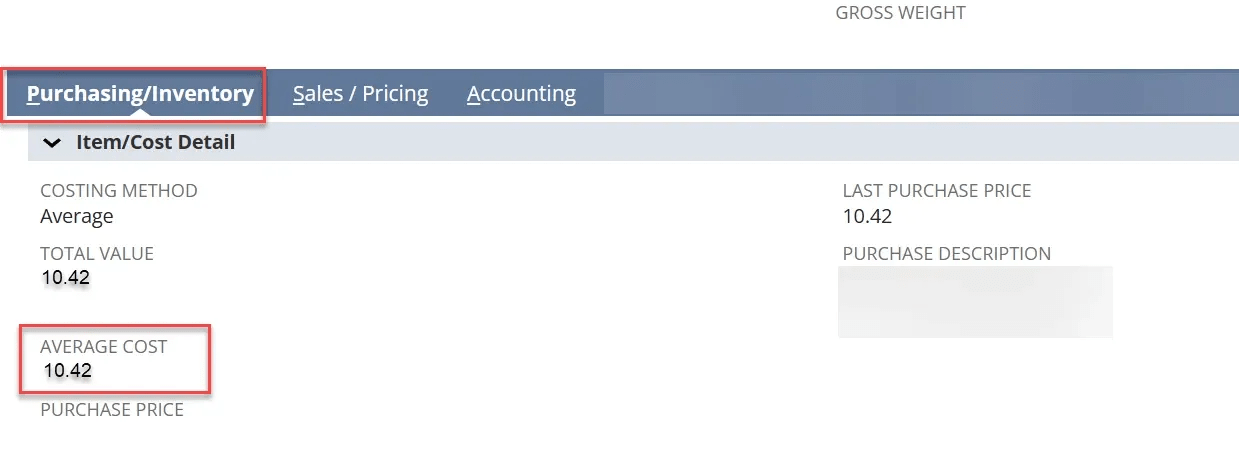
The estimated unit cost is NetSuite’s best guess at the value of the inventory; for average costing, it comes from the Average Cost field on the item record.
Image shows item record’s Purchasing/Inventory tab with Average Cost field highlighted.
This cost is recalculated every time you enter a transaction that changes inventory levels. Here is an example of how it works.
If I enter the following on the same date:
IR 1: Item A | Unit Cost $1 | QTY 2
IR 2: Item A | Unit Cost $2 | QTY 5
My average cost will average the $1 inventory with the $2 inventory, so $1.71. But if I sell both items valued at $1, my average cost of inventory on hand goes from $1.71 to $2.0 (12/7 vs 10/5). So, naturally there may be some change in the Est. Unit Cost between one inventory adjustment and another since inventory values have changed.
Cost Variances and $0 Inventory Values
If there is significant variance between values entered on item receipts, there can be a larger swing in the average cost after transactions are entered, especially if some inventory was incorrectly valued at $0 – you may not even see the $0 inventory because the cost is an average, but it would be significantly devaluing your inventory. When entering positive adjustments, make sure you override the Est Unit Cost’s value if it is set to $0.
Comprehensive data on market growth, ROI metrics, technology adoption, and implementation best practices for manufacturers seeking competitive advantage through automation. The manufacturing inventory automation market is experiencing explosive growth, yet implementation success varies dramatically. With the NetSuite for manufacturers platform now enabling advanced automation capabilities including work orders, assembly builds, and BOMs, understanding current adoption patterns and performance benchmarks becomes essential for strategic decision-making. This data-driven analysis examines 22 critical statistics that reveal where the market stands, what ROI manufacturers actually achieve, and how implementation complexity shapes competitive outcomes.
Essential data on inventory accuracy, turnover ratios, automation benefits, and supply chain performance for wholesale distribution businesses.
Organizations partnering with experienced NetSuite consultants gain the inventory automation needed to outperform competitors. Top performers achieve 95% inventory accuracy while struggling businesses operate at just 65%, representing millions in locked capital and lost sales opportunities.
A recent client had a highly structured, customer-centric order process that relied on employees manually recreating information already stored in NetSuite. Anchor Group transformed that process into an intelligent (automated) communication ecosystem spanning the entire customer journey—from order entry through production, fulfillment, change requests, samples, pro forma approvals, product reviews, and back orders—eliminating hours of repetitive work each day while improving customer visibility, consistency, and trust.